


This video features Diana Krupa, WaterCube Co-Founder and Chief Executive Officer alongside Littoral Power CEO David Duquette as both discuss the tremendous potential of tidal power for future electricity generation, as advances in tidal energy are bringing the cost of tidal power down to manageable levels.
This interview also showcases the innovative array of hydrologic research tools made available by WaterCube using cutting edge, proprietary technology software.

Watch “Hall Of Fame”quarterback Terry Bradshaw introduce WaterCube as an innovative new enterprise who focuses on one of the world’s most abundant forms of renewable energy.
In this video, you will find out how WaterCube provides clients with high-quality 3D spatial views of bathymetry and velocity data for rivers, reservoirs and floodplains using the most advanced sensing and visualization technologies in the world in the most efficient and affordable manner.

Watch how WaterCube helps you create and assess your river or reservoir in days to create the visual story you need to analyze your river quickly and efficiently. From instream flow assessments, stream power optimiization, sediment transfer studies, evaluating habitat suitability, analyzing river restoration efforts and more.
Create digital elevation model’s (DEM) in a snap and visualize your river and reservoir within days while calibrating your hydraulic model with real spatial data to predict future behavior.
3D Data Never Looked So Good!
Learn best practices for collecting your data to seamlessly CUBE your river.
Using “Go with the Flow” techniques will help you optimize your spatial data collection and get the results you have been after.
Learn how to hit the water with not only one ADCP but many at one time to get the most out of your data collection efforts. Collect, Process and Visualize your Digital Elevation Models in a snap. Real 3D data never looked so good.
Learn from a master (Dr. Art Schmidt, PHD ) of how you can apply some advanced hydraulic calculations to your data and solve real world problems. The power of having real 3D spatial data allows you to start looking at all types of hydraulic calculations right from within the Cubeit software. For a video on the possibilities see the webinar section.
Please join us in viewing some of our latest webinars whereby leading scientists, consultants and partners are utilizing WaterCube processing and Visualization software (Cubeit) to solve real world problems in the water resource industry. The following webinars showcase many of the datasets and case studies completed utilizing WaterCube and highlight the applications in which the results were applied.
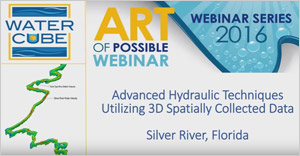
Welcome to an entirely new way of measuring and analyzing your river with WaterCube. In this webinar we will explore the Silver River in Florida and explore the beautiful springs and the impact of invasive vegetation utilizing advanced data collection techniques and WaterCube processing to visualize over 9km of river reach. In addition, a 3D hydrodynamic model is being calibrated with real data collected over the course of 6 quarters to analyze the impact of seasonal changes.

This webinar introduces WaterCube processing and the Cubeit visualization software and it’s many applications in the water resource arena. Taking a case study from the Snake River and CJ strike Dam in Boise, Idaho as a prime example of a complex Hydropower site for velocity indexing and instrument placement.

The “Art of the Possible” takes you through the various applications and hydraulic computations and data analysis that can be done on spatial river data collected and processed with WaterCube. Right from within the Cubeit software you will explore how to analyze stream power, shear stress, habitat suitability and model calibration utilizing this advanced technology.
This webinar explores a case study of the River Severn in the UK and the partnership with Xylem Analytics. From within the Cubeit software you will learn how to analyze spatial data for selecting a suitable velocity indexing site and optimal instrument placement for monitoring.
Please view many of the Case studies that have been completed using WaterCube processing and Cubeit visualization software. WaterCube is utilized all over the world to measure, process and visualize river data like never before. The following case studies highlight various rivers within the U.S. such as the Sacramento, Snake and Silver Rivers along with international studies in Australia, South Africa and the U.K.
In this section, you will find a list of tutorials to get you started with your WaterCube processed data and the Cubeit visualization software. The quickstart tutorials are intended to be completed in the order in which they are numbered below. Each tutorial is approximately 5 minutes or less and will give you a good overview of the process and our software.
In this section, you will find a list of tutorials to get you started with your WaterCube processed data and the Cubeit visualization software. The quickstart tutorials are intended to be completed in the order in which they are numbered below. Each tutorial is approximately 5 minutes or less and will give you a good overview of the process and our software.